Defining the Roadmap for a European Cancer Data Space


WORKSHOP

Defining the Roadmap for a European Cancer Data Space

By Stefania Amodeo

SciLake representatives participated to the EOSC4Cancer consultation to define a Roadmap for a European Cancer Data Space. This article recaps the key points from the workshop.


EOSC4Cancer, the European-wide foundation to accelerate data-driven cancer research, recently held a face-to-face workshop in Brussels to define a Roadmap for a European Cancer Data Space. SciLake representatives participated in a discussion with around 30 stakeholders from various sectors including research, industry, patient care, survivor groups, and EOSC. The discussion focused on key aspects for a sustainable cancer dataspace, such as access models, governance, data quality, security, and privacy.

The insights collected will be used in the creation of a roadmap, scheduled for publication in early 2025. This roadmap aims to shape the future of the European cancer dataspace, with policy recommendations to the European Commission.

EOSC4Cancer Objectives

EOSC4Cancer is a Europe-wide initiative that aims to accelerate data-driven cancer research. Launched in September 2022, this 30-month project will provide an infrastructure to exploit cancer data. It brings together comprehensive cancer centers, research infrastructures, leading research groups, and major computational infrastructures from across Europe.

The expected outcomes include a platform designed for storing, sharing, accessing, analyzing, and processing cancer research data. This involves interconnecting and ensuring interoperability of relevant datasets, as well as providing scientists with easy access to cancer research data and analysis systems. Additionally, the initiative will contribute to the Horizon Europe EOSC Partnership and other partnerships relevant to cancer research.

A Federated Digital Infrastructure for accelerating Cancer Research

The EOSC4Cancer Roadmap envisions a federated digital infrastructure to accelerate cancer research in the EU. It will rely on existing European and national structures and serve as the digital data infrastructure for the future Virtual European Cancer Research Institute, a platform enabling storage, sharing, access, analysis, and processing of research data. The structure will align with major European efforts for enabling the use and re-use of cancer-related data for research and will accommodate varying levels of maturity across member states. The federated infrastructure will include centralized components and capabilities, remote software execution, and a Cancer Research Commons repository. Each EU Member State is expected to have a National Data Hub for Cancer-related data and other relevant structures, such as national nodes and reference hospitals.

The plan is to develop in stages, first focusing on National Data Hubs, then involving Competence Centers and other participants. The National Data Hubs will reflect the structure of the Digital Hub. They will host a national database for cancer research data, allow the use of Research Environments, provide computing power, and coordinate outreach efforts.

Roundtable Discussions

The workshop held roundtable discussions on four topics: missing data types, missing data sources, requirements for national nodes, and any other element missing from the roadmap.

The first topic focused on identifying missing data types, such as synthetic data, specified clinical data, reference data, specified clinical data, social data, patient-generated data, and epidemiology of survivors. The discussion also emphasized the importance of preparing data for future use, connecting different types of data across various platforms, and ensuring that data comes from reliable sources by implementing quality checks and guidelines for data submission.

The second topic revolved around the data sources, discussing what is missing in the long list of data sources, how trusted they are, and how they can be connected and prioritized. The key sources identified include structural biology data, patient-generated data, demographic data, complete clinical trial datasets, and biobanks.

The third topic concerned the requirements for national nodes. The discussion recognized that these nodes should be flexible and adaptable to the needs of different countries. It was agreed that coordinating existing initiatives, while not necessarily simple, is preferable to creating something new.

In conclusion, additional elements for the roadmap were identified. These relate to the patient journey, the treatment and product development journey, and non-tangible aspects such as data governance, clinical data usage, and cybersecurity. The roadmap should also consider incentives for scientists, communication strategies, and a plan for the platform's sustainability.

Conclusion

The workshop was a significant step towards defining the Roadmap for a European Cancer Data Space. The insightful discussions and collaborative efforts of the participants identified the requirements for comprehensive cancer data, trusted data sources, and functional national nodes.

Through these collaborative efforts, the EOSC4Cancer initiative is paving the way for a more data-driven and interconnected future in cancer research across Europe.

Read more …Defining the Roadmap for a European Cancer Data Space

Amplifying Valuable Research: How?


SciLake technical components

Amplifying Valuable Research: How?

By Stefania Amodeo

In today's fast-paced scientific landscape, it has become increasingly challenging for researchers to identify valuable articles and conduct meaningful literature reviews. The exponential growth of scientific output, coupled with the pressure to publish, has made the process of discovering impactful research a daunting task.

In a webinar for SciLake partners, Thanasis Vergoulis, Development and Operation Director of OpenAIRE AMKE and scientific associate at IMSI, Athena Research Center, discussed the technologies developed to assist knowledge discovery by leveraging impact indicators as part of SciLake's WP3: Smart Impact-driven Discovery service.

This article recaps the key points from the webinar.

Impact Indicators and knowledge discovery

Scientists heavily rely on existing literature to build their expertise. The first step is to identify valuable articles before reading them. Unfortunately, this process has become increasingly tedious due to the overwhelming volume of scientific output. The increasing number of researchers and the notorious publish-or-perish culture have contributed to this exponential growth, making it difficult and time-consuming to identify truly valuable research in specific areas of interest.

Impact indicators have been widely used to address this challenge. The main idea is to look at how many articles cite a particular article, which serves as an indication of its scientific impact. This is formalized through the citation count indicator.

Thanks to the adoption of Open Science principles, there is now a wealth of citation data available from initiatives like Open Citations and Crossref. As a result, the now-available citation data offer adequate coverage to estimate the scientific impact of an article analyzing its citations. Of course, scientific impact is not always highly correlated with scientific merit, hence it is always important to remember that an article of great value might not always be popular.

While citation count is a popular impact indicator used in academic search engines like Google Scholar, it has its limitations. Scientific impact is multifaceted, and one indicator alone is not sufficient to measure it. Other pitfalls related to citation count, that may hinder the discovery of valuable research, are the introduction of biases against recent articles and the potential for gaming the system by attacking this indicator with particular malpractices. To mitigate such issues, it is crucial to use indicators that capture a wide range of impact aspects. Additionally, considering indicator semantics and provenance helps protect against improper use and misconceptions.

How it started…

To study this problem, researchers from Athena Research Center (ARC) conducted a comprehensive survey and a series of extensive experiments to explore different ways to calculate impact indicators and rank papers based on them. Four major aspects of scientific impact were identified that should be combined:

  • Traditional impact, estimated with citation counts
  • Influence, estimated using the PageRank algorithm, which considers the impact of an article even if it is not directly cited
  • Popularity, estimated using the AttRank algorithm, which considers the fact that recent papers have not had sufficient time to accumulate citations
  • Impulse, estimated using 3-year citation counts to capture how quickly a paper receives attention after its publication

Building upon these aspects, ARC researchers developed a workflow to calculate these indicators for a vast number of research products and made them openly available to the community, enabling third-party services to be built on top of them.

…how it is going

The workflow to the BIP! Database and Services

The current workflow developed by ARC starts with the OpenAIRE Graph, where citations are collected as a first proxy of impact. A citation network is built based on this information. ARC has developed an open-source Spark-based library called BIP! Ranker, which calculates indicators for approximately 150 million research products. While computationally intensive, the calculations can be performed within minutes or hours on a computer cluster, depending on the indicator. The resulting indicators are available on Zenodo as the BIP! DB dataset and advanced services, such as BIP! Finder, BIP! Scholar, and BIP! Readings are also provided based on these indicators. Finally, the indicators are integrated back into the OpenAIRE Graph, ensuring their inclusion in any data snapshot of the graph downloaded. In addition, the workflow classifies research products based on their ranking and can provide, for example, the results within certain percentage thresholds, (e.g. being in the top 1% of the whole dataset or of a particular topic). During the process of calculating the indicators, various checks should take place. For instance, to prevent the duplication of citations, it is ensured that multiple versions of the same article, such as pre-prints and published versions, are not counted twice. Additionally, there are plans to eliminate self-citations in the future and to give the option to select whether to consider only citations from peer-reviewed articles or not.

So, what can we use?

BIP! Finder: the service that improves literature search through impact-based ranking

In the BIP! Finder interface, users can perform keyword-based searches and rank results based on different aspects of impact (e.g., popularity or influence). This allows users to customize the order of the results. Each result also displays the class that each publication has according to the four main impact indicators available through the interface. The service also provides insight into how a paper is ranked among others in a specific topic. This is particularly useful in cases of highly specialized papers which would unlikely rank high in a large database.

Preparations for SciLake pilots

The BIP! services bundle now includes the BIP! spaces service that allows building domain-specific, tailored BIP! Finder replicas. The main purpose of these spaces is to use them as demonstrations for the pilots of the SciLake project. The service will provide knowledge discovery functionalities based on impact indicators and incorporating information from the domain-specific knowledge graphs that the pilots are building.

What each pilot gets:

  • a preset in the search conditions, such as the preferred way to rank the results,
  • query expansions with additional keywords based on domain-specific synonyms (e.g., synonyms in gene names in cancer research),
  • query results including domain-specific annotations based on pilots' scientific knowledge graphs.

Future extensions:

  • support for annotating publications to extend the domain-specific SKGs:
    • enabling users to add connections of publications and other objects to domain-specific entities and include these relations into their SKG,
  • additional indicators,
  • support for domain-specific highlights:
    • flags for collections of papers that are important in a specific community,
  • topic summarization & evolution visualisation features.

Conclusions

By leveraging impact indicators, researchers can navigate the vast scientific landscape more effectively, discover valuable research, and make informed decisions in their respective fields. This paves the way for accelerating knowledge discovery and amplifying the impact of valuable research.

Stay tuned for more updates on how SciLake is amplifying valuable research!

bip articles, training

Read more …Amplifying Valuable Research: How?

The OpenAIRE Graph: What's in it for Science Communities?


SciLake technical components

The OpenAIRE Graph: What's in it for Science Communities?

By Stefania Amodeo

In a webinar for SciLake partners, Miriam Baglioni, researcher at the National Research Council of Italy (CNR) and one of the OpenAIRE Graph developers, introduced the OpenAIRE Graph and discussed its benefits for science communities. This article recaps the key points from the webinar.

In the era of Open Science, it has become crucial to track how scientists conduct their research. The concept of "discovery" has evolved, and now we aim to enable reproducibility and assess the quality of research beyond just publications. The OpenAIRE Graph was developed for this purpose. This graph is a collection of metadata describing various objects in the research life cycle, forming a network of interconnected elements.

Motivation and concept

The OpenAIRE Graph aims to be a complete and open collection of metadata describing research objects. It includes data from various big players, such as Crossref, to be as comprehensive as possible. To maintain accuracy, the graph is de-duplicated, meaning that when metadata from different sources are available for the same research result, only one entity is counted for statistical purposes. Transparency is also a key aspect, as provenance information is marked and traced within the graph. Additionally, the OpenAIRE Graph is built to be participatory, allowing anyone to contribute their data following the provided guidelines. The graph also strives to be decentralized, enriching information from repositories and pushing it back to the original sources. By including trusted providers, the graph becomes a valuable resource for researchers throughout the research life cycle.

Graph Concept: open, complete, de-duplicated, transparent, participatory, decentralized, trusted

Data Sources and Data Model

Everyone is free to share their data with the graph by registering on one of our services and sharing the metadata. We currently have more than 2,000 active data sources. These include institutional and thematic repositories, funder databases, entity registries, organizations, ORCID, and many more sources. All the metadata from these different entities are interconnected.

OpenAIRE Graph Data Model
The OpenAIRE Graph Data Model

Building Process

The OpenAIRE Graph is built upon metadata provided voluntarily by data sources. Regular snapshots of the metadata are taken and combined with full-text mining of Open Access publications to enrich the relationships among entities. Duplicates are handled by creating a representative metadata object that points to all replicas. The graph then goes through an enrichment process, utilizing the existing information to further enhance the relationships and results. Finally, the graph is cleaned and indexed, making it accessible through the API and OpenAIRE's value-added services.

The OpenAIRE Graph supply chain

Connection to Science Communities

The OpenAIRE Graph has significant relevance and connections to various science communities. SciLake's pilots will receive the following benefits:

  • For Cancer research, the graph imports metadata from PubMed and plans to integrate citation links between PubMed articles.
  • For Energy research, there is already a gateway called enermaps.eu that provides access to relevant information and the graph will add further linkage options.
  • For Neuroscience, interoperability options between the OpenAIRE Graph and the EBRAINS-KG will be offered.
  • For the Transportation research, two paths are envisaged:
    • access products related to the TOPOS gateway (beopen.openaire.eu), which contains all the relevant information for transportation research included in the graph,
    • investigate interoperability options between the OpenAIRE Graph and the Knowledge Base on Connected and Automated Driving (CAD)

The OpenAIRE Graph continues to evolve and welcomes ideas and collaborations from all science communities.

Challenges and perspectives

Building and maintaining the OpenAIRE Graph comes with its own set of challenges. Combining domain-specific knowledge with domain-agnostic knowledge can be complex, especially when dealing with unstructured files and non-English texts. The format and organization of data vary across communities, making it difficult and unsustainable to include everything in the graph.

While challenges exist, the SciLake project plays a pivotal role in improving and expanding the OpenAIRE Graph to accommodate new entities ensuring its relevance and usefulness for the scientific community.

To learn more about the OpenAIRE Graph, visit the website graph.openaire.eu and explore the documentation on data sources and the graph construction pipeline.

training

Read more …The OpenAIRE Graph: What's in it for Science Communities?

  • Created on .

Insights into the Potential of Scientific Knowledge Graphs

Survey Results: Insights into the Potential of Scientific Knowledge Graphs

Scientific Knowledge Graphs (SKGs) have been gaining attention in the research community for their ability to convert data into knowledge. To understand the perspectives and expectations surrounding SKGs, an online survey was conducted during the Open Science Knowledge Graph workshop held during the OSFAIR 2023.

In this blog post, we will delve into the survey results and highlight the key insights regarding the participants' roles, main uses of SKGs, and the features that should be improved or added to enhance SKG effectiveness.

Role of survey's participants within the research community

Participants' roles

The survey participants consisted of 61 individuals from various roles within the research community: service providers (31%), researchers (28%), research administrators (28%), policy makers (6%), publishers (5%), and funders (2%).

Main Uses of SKGs

When it comes to the main use or interest in SKGs, the survey revealed a wide range of applications and benefits. These included:

  • Providing an alternative to proprietary graphs
  • Implementing FAIR (Findable, Accessible, Interoperable, and Reusable) principles
  • Enhancing decision-making processes
  • Mapping data stewardship services in a Knowledge Graph
  • Helping researchers track the impact of their research and maximize its use
  • Improving research discovery and dissemination
  • Leveraging NLP (Natural Language Processing) techniques to enhance search capabilities
  • Facilitating research assessment, monitoring, and reporting
  • Exploring the science of science: understanding the scientific ecosystem and generating new knowledge about research evolution
  • Analyzing and feeding internal reports on institutional behavior and its context
  • Obtaining a complete picture of one's research area of interest at any given time
  • Gaining insights into the interests and working areas of researchers within a country to provide better research opportunities and effectively connect them with funders
  • Retrieving high-quality metadata for semantic analysis
  • Harnessing the capabilities of SKGs to visualize the scientific workflow and unlock new possibilities for information discovery and correlation creation

Additionally, participants noted that SKGs underlie a number of services that research communities use, highlighting the importance of understanding how SKGs operate for those involved in research support.

Improvements and Additional Features

To fully harness the potential of SKGs, participants identified certain improvements and additional features that they believed would enhance their effectiveness. These suggestions included:

  • Implementing persistent identifiers (PIDs) for organizations to account for historical changes such as institution name changes or mergers
  • Supporting multilingualism to facilitate the accessibility of SKGs across different language communities
  • Ensuring reliability, curation, and monitoring of metadata quality to maintain the integrity and usefulness of SKGs
  • Streamlining the querying process to make it easier and more user-friendly
  • Empowering business intelligence (BI) with multiple options to enable comprehensive analysis and decision-making capabilities
  • Providing information about retractions to ensure the accuracy and reliability of research findings
  • Addressing the challenges associated with scholarly publication workflows, particularly the unruled and uncontrolled manner in which researchers publish papers, data, and software in open science
  • Involving the community in data curation to leverage collective expertise and ensure the accuracy and relevance of SKGs
  • Offering a simple data model that does not compromise information, semantics, and provenance while making it easier to navigate and understand the SKGs

Participants also emphasized the importance of a user-friendly interface to enhance the accessibility and usability of SKGs.

Conclusions

The survey results shed light on the roles, main uses, and expectations surrounding Scientific Knowledge Graphs (SKGs). From enabling better research discovery to supporting decision-making processes, SKGs have the potential to transform the way we manage, explore, and analyze scientific knowledge. By addressing the suggested improvements and adding the desired features, the scientific community can fully leverage the power of SKGs and unlock new possibilities for research and knowledge discovery.

Read more …Insights into the Potential of Scientific Knowledge Graphs

Open Science Knowledge Graphs

 ∙ Stefania Amodeo

Scientific Knowledge Graphs (SKGs) are of great value to the research community in converting data into knowledge. In a recent workshop at the Open Science Fair in Madrid, experts from various disciplines came together to discuss the potential and challenges of SKGs.

This blog post highlights the key insights from the workshop, including the presentations, discussion highlights, and the next steps in advancing SKGs.

Presentations

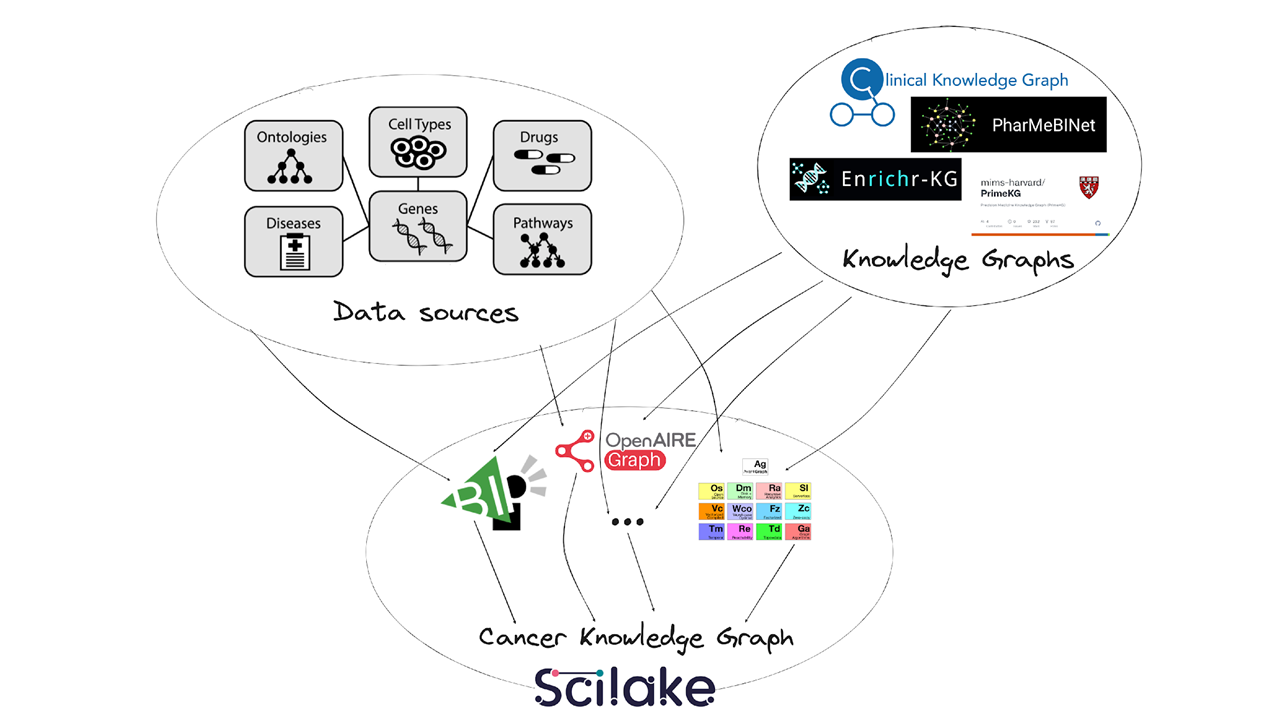
The workshop featured five speakers who presented compelling cases of SKGs and their applications in different domains. Thanasis Vergoulis from Athena RC discussed the status of the OpenAIRE Graph and its enrichment through the EU SciLake project. Ingrid Reiten from the University of Oslo highlighted the synergies between the EBRAINS data and knowledge service and SciLake, specifically in the neuroscience research domain. Leily Rabbani from the Karolinska Institute shared the roadmap for building a cancer knowledge graph through SciLake. Joaquín López Lérida from LifeWatch ERIC introduced the LifeBlock tool for the construction of SKGs for the biodiversity research domain. Finally, Max Novelli from the European Spallation Source presented the PaNOSC data portal for the photon and neutron community.

All the presentations are accessible on Zenodo: https://zenodo.org/record/8402580

Discussion Highlights

The round table discussion provided valuable insights into the challenges and potential of SKGs. Participants actively engaged with the speakers. An online survey was conducted to gather participants' roles, main uses of SKGs, and suggestions for improvement. Some notable highlights from the discussion include:

  • SKGs enhance research productivity and enable quicker translation of hypotheses into results. They serve as a foundation for powerful tools that aid researchers and stakeholders in making informed decisions based on factual information.

  • SKGs catalyze the development of services for advanced knowledge extraction and exploration. By leveraging the interconnectedness of data, SKGs enable researchers to uncover hidden relationships and patterns, leading to new discoveries and insights.

  • Interoperability between graphs is a significant area of progress. Efforts are being made to ensure that SKGs from specific domains can seamlessly integrate and exchange information with cross-domain graphs, like the OpenAIRE Graph, fostering interdisciplinary research.
  • Incorporating sensitive data into SKGs presents a challenge. However, blockchain technology offers a promising solution by providing a secure and transparent framework for managing sensitive information while maintaining data integrity and privacy.


Next Steps

Building on the momentum of the workshop, the participants identified key next steps to further advance SKGs. These steps include:

  • Exploiting the synergies between the different initiatives presented during the workshop to create domain-specific, interlinked SKGs.

  • Addressing various challenges in delivering high-quality SKGs:
    • ensuring broad coverage of scientific knowledge,
    • promoting interoperability between domain-specific and cross-domain SKGs,
    • ensuring long-term sustainability,
    • improving the accuracy and reliability of data sources,
    • incorporating multilingual content,
    • enabling computational reproducibility,
    • adopting good curation practices for domain-specific SKGs.

The scientific community can harness the full potential of SKGs by pursuing these next steps, transforming the way we discover and assess scientific knowledge.