Domain-Specific Machine Translation for SciLake
Domain-Specific Machine Translation for SciLake
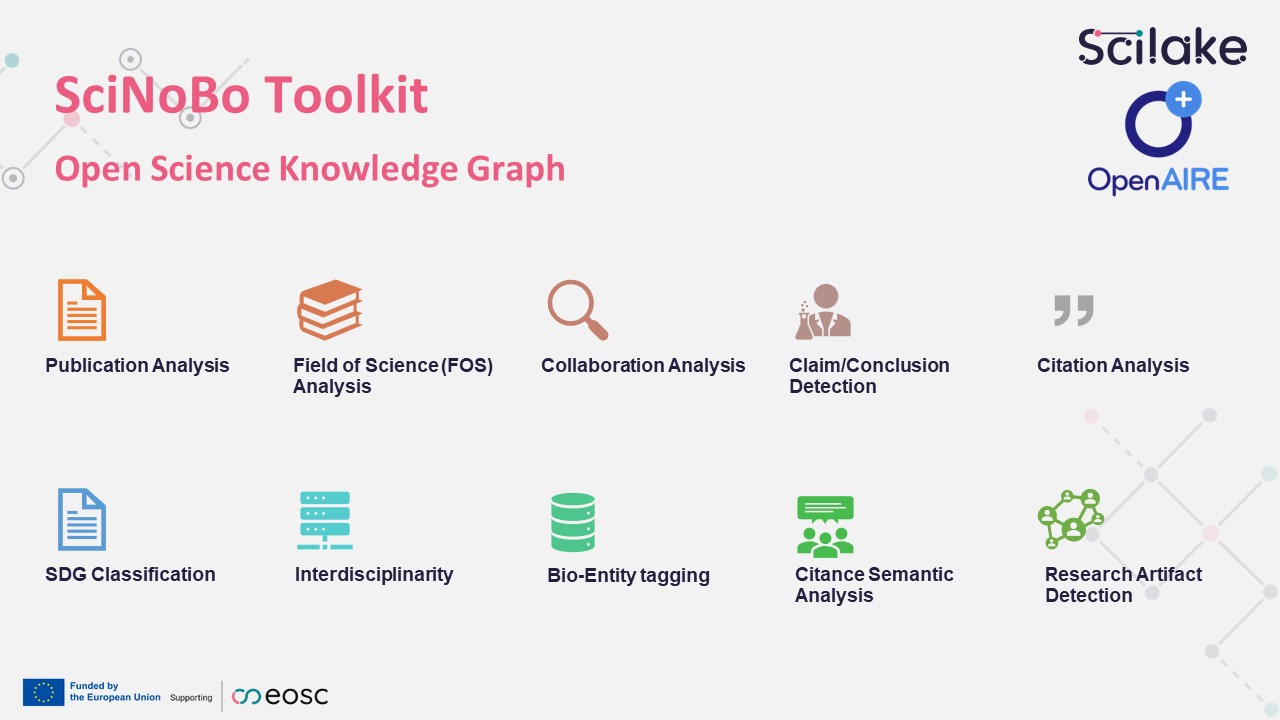
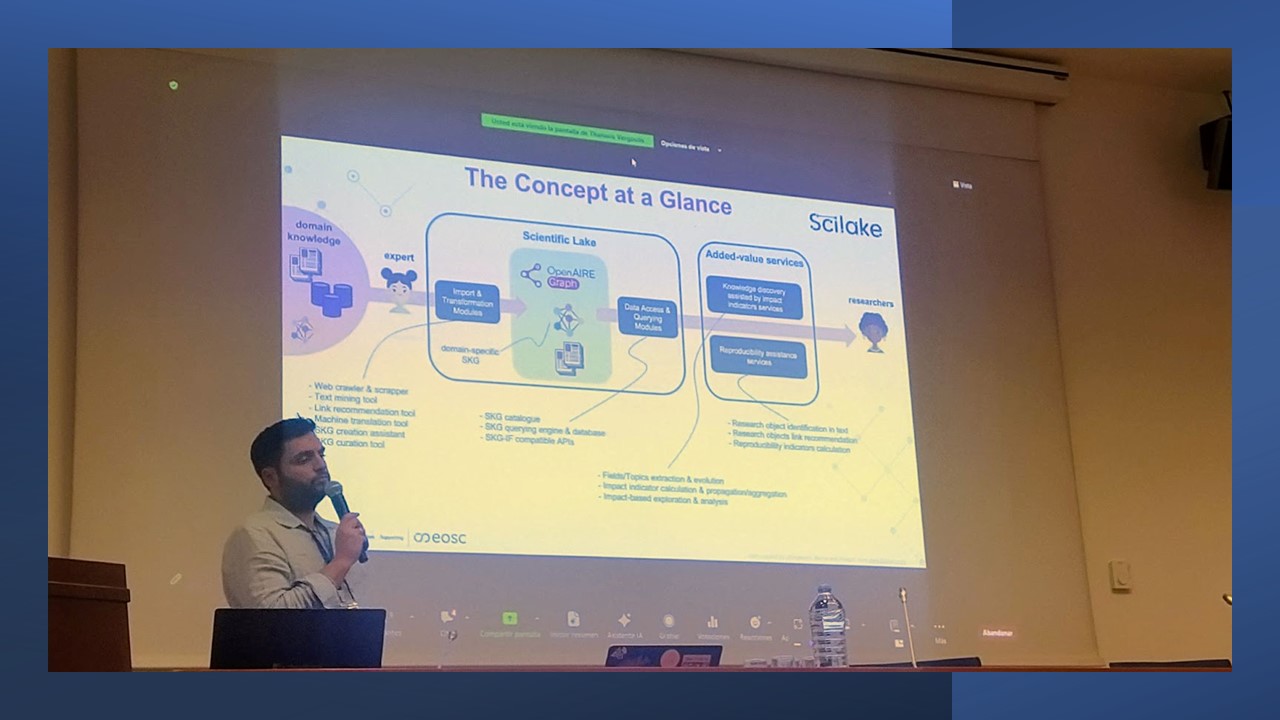
In a recent webinar for SciLake partners, Sokratis Sofianopoulos and Dimitris Roussis from Athena RC presented their cutting-edge Machine Translation system, which will be integrated into the Scientific Lake Service.
The presentation emphasized the significance of gathering domain-specific parallel data to train machine translation systems. It specifically focused on the language pairs of French to English, Spanish to English, and Portuguese to English. Additionally, a demonstration of a few models created so far was showcased during the presentation.
This blog post recaps the key points from the webinar.
Challanges
Machine translation involves the automated process of translating text or speech from one language to another. The current state of the art utilizes deep learning approaches like sequence-to-sequence models and transformers. However, challenges arise when applying machine translation to specialized domains such as medical or scientific documents due to technical terms. The solution is to collect in-domain data and use them to fine-tune existing state-of-the-art machine translation models of the general domain for the specific language pair of interest.
Data collection
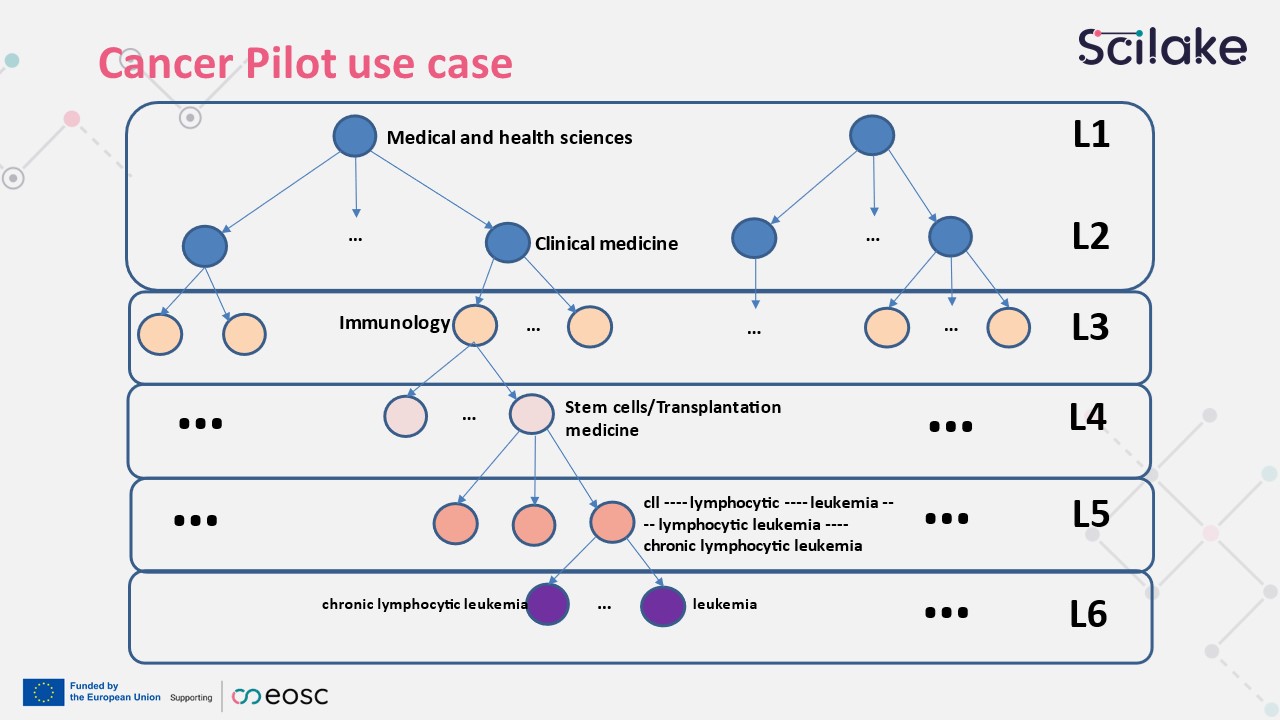
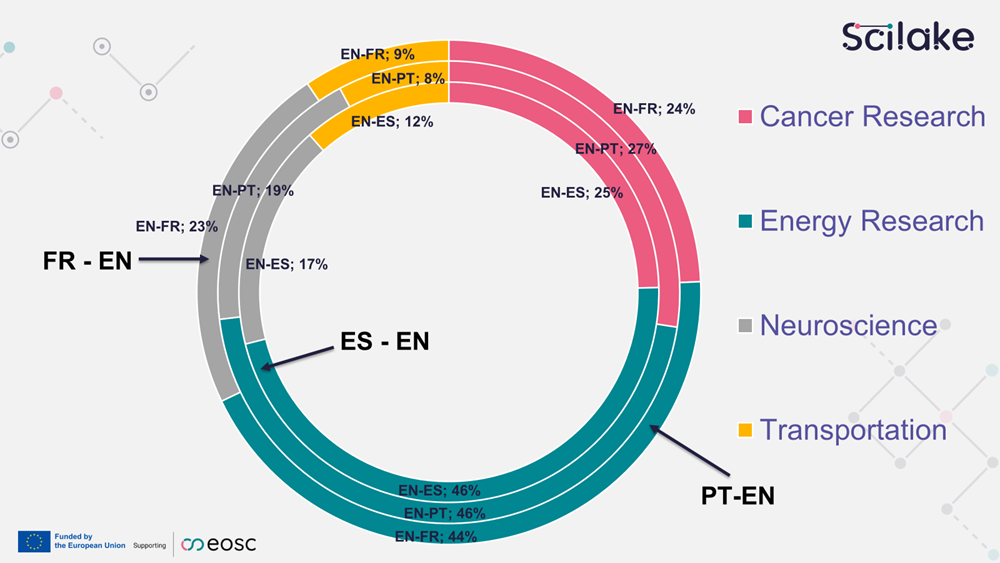
The team has focused on collecting domain-specific parallel data from the four SciLake pilot domains: Cancer Research, Energy Research, Neuroscience, and Transportation Research. Additionally, they have gathered general-purpose scientific data to ensure comprehensive coverage.
The data collection process involved downloading approximately 9.3 million records from 62 repositories, including theses, dissertations, and various scientific documents. The team meticulously parsed and classified the records, extracting metadata such as authors' names, abstracts, and titles. The result is a vast collection of parallel and monolingual sentences in English, Spanish, French, and Portuguese.
To ensure the quality of the machine translation systems, the team created benchmark test sets for each domain. These sets consist of 1000 parallel sentences, divided into developer and test sets. Additionally, a larger test set of 3000 parallel sentences was created for the general academic domain. These test sets allow for the evaluation of the fine-tuned models.
Translation Models
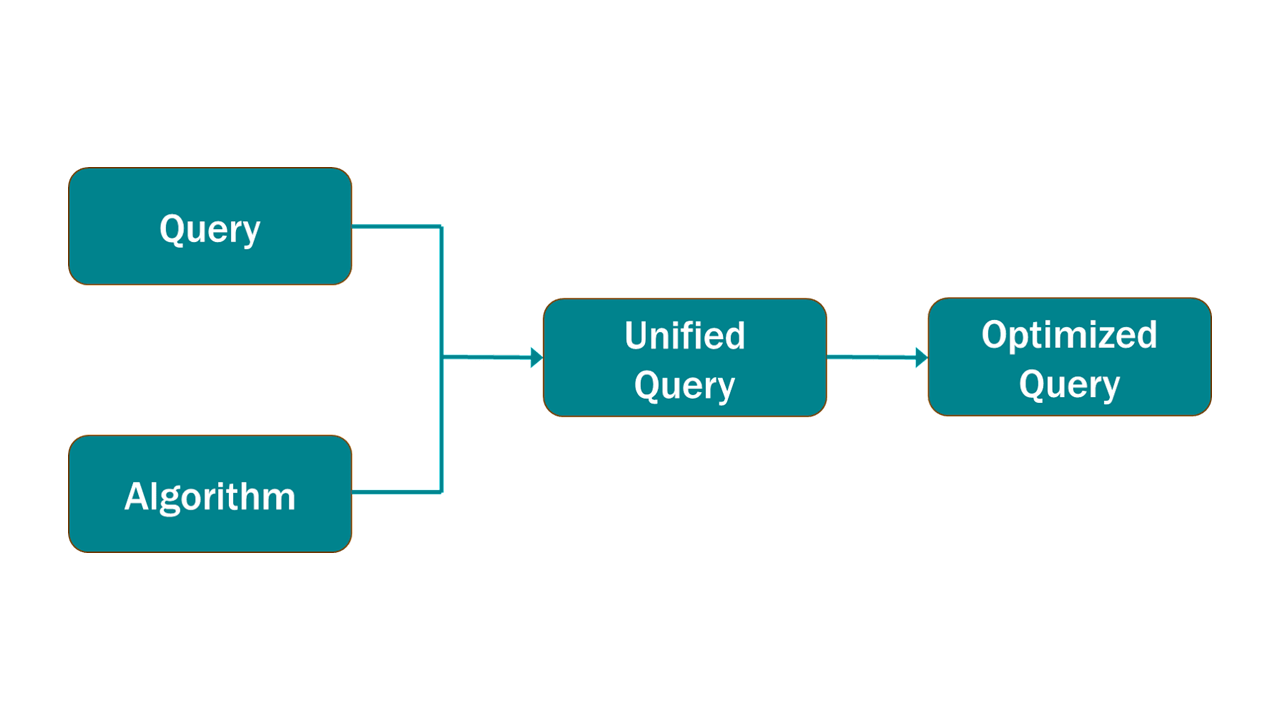
To enhance the performance of the machine translation models, the team utilized a combination of in-domain data and general academic data. Since in-domain data was limited, the team incorporated as much relevant data as possible to improve the performance of the general-purpose models. For language pairs such as French to English and Spanish to English, the team employed the Big Transformers architecture, which consists of deep learning models with approximately 213 million parameters. For Portuguese to English, a Base Transformers architecture with fewer (65 millions) parameters was used.
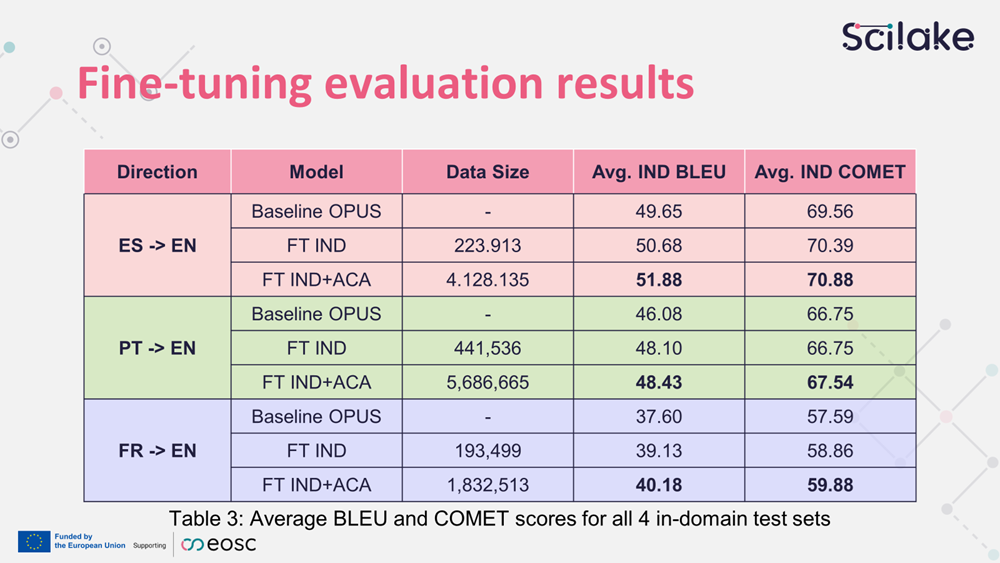
The initial results, reported in the table below, show that current models (fine-tuned with only in-domain data as well as fine-tuned with a combination of in-domain data as well as general academic data) perform reasonably well. The evaluation scores are based on two well-established metrics used in machine translation for the past decade: the BLEU and the COMET indices, which are computed by comparing the machine-generated translations with reference translations. Notably, the French to English system reported the lowest scores, likely due to the limited amount of data available for this specific language pair.
The results also show a significant improvement in scores after fine-tuning with both in-domain and academic corpus data. On average, mixing data resulted in a 2.5% increase in scores. The in-domain data contributed 1.5+ points to the scores, while the general academic data added almost an additional point.
How can we improve the results?
These findings are based on the first year of working with the fine-tuning process. The team has numerous ideas for further improving the results, including exploring multi-domain adaptation, finding more data sources, and using machine translation for back-translation to generate additional data. Additionally, they plan to integrate the machine translation models with the SciLake infrastructure and collaborate with project partners to maximize the potential benefits.
Demo
The team presented a web interface for translation requests and showcased the capabilities of the platform. Currently, this system is an internal prototype used for evaluating machine translation models and experimenting with various processes, such as generating text for future post-editing, and exploring new ideas. As an example, a Firefox plugin has been developed to allow users to request webpage translation using the Spanish model. This plugin is useful for translating Spanish articles while browsing.
Conclusions
Overall, the presentation offered valuable insights into the process of fine-tuning and evaluating machine translation models for specialized domains. With ongoing research and improvements, integrating domain-specific machine translation into the SciLake infrastructure holds great potential for enhancing scientific communication and collaboration.